During the first part of my analysis I made the suggestion, that the #2 Audi tried to save fuel. Average topspeed and laptimes let me make this idea work. In reality they had the most stops of all 5 cars.
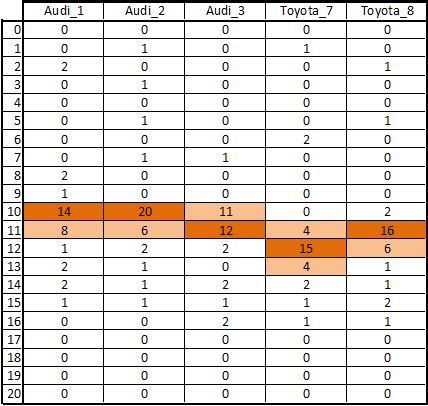
But they seem to have a different strategy as you can see in the following table. I think it is fair to say, that everything above 12 laps/stint for the Audis is caused by the weather situation or a safety car period, while all more than 13 laps for Toyotas is unusual. Mr. Gauss would love this table, because it says, that #1 & #2 were set for 10 laps, while #3 was set for something between 10 and 11 laps – going faster, doing less laps and viceversa. Toyota #7 did the expected 12 lap job, but surprinsingly the #8 regularly did just 11 laps. The two parts before fit perfectly into the forming picture, that #1, #2 and #7 did what everyone had predicted, while #3 and #8 fitted into the gap between.
| Audi_1 | Audi_2 | Audi_3 | Toyota_7 | Toyota_8 | |
| No. Pitstops | 33 | 35 | 31 | 30 | 31 |
| Avg. No. Laps | 10,2 | 9,5 | 11,2 | 11,6 | 11,2 |
| <10 laps | 5 | 4 | 1 | 3 | 2 |
| No. 10 laps | 14 | 20 | 11 | 0 | 2 |
| No. 11 laps | 8 | 6 | 12 | 4 | 16 |
| No. 12 laps | 1 | 2 | 2 | 15 | 6 |
| No. 13 laps | 2 | 1 | 0 | 4 | 1 |
| >13 laps | 3 | 2 | 5 | 4 | 4 |