Alle Beiträge von Steffen

Le Mans 2014: GTEpro: Gap to Ferrari #51

When you put the gap between the winning Ferrari #51 and the other cars into a chart, you can see how close the battle was at the beginning of the race until one after the another got problems. But it also shows that the Corvette #73, who were 10 minutes behind after 2/3rd of the race reduced the gap to 5 minutes to the end of the race – really, really quick machine!

Negative values mean the Ferrari was behind, positive infront of the opponent.

LM2014_gtePRO_GAP_TO_51

Le Mans 2014: GTEpro: Pitstops and Stint length

I choose the quickest car of each manufacturer for this chart and it seems that all were able to do 14 laps per stint, only Corvette had to switch between 13 and 14 laps, while Porsche clearly shows their fuel cell trouble.

LM2014_GTEpro_stintlength


Ferrari_51 Ferrari_52 Ferrari_71 Chevrolet_73 Chevrolet_74 Porsche_79 Porsche_91 Porsche_92 AstonMartin_97
Pitstops 27 15 2 26 27 25 25 28 26
Avg 12,6 9,4 14,5 13,0 12,4 12,8 12,4 12,1 12,0
Pittime 00:35:25,419 05:08:10,620 00:04:55,033 00:41:00,681 01:13:09,409 00:53:37,367 02:30:42,135 00:37:40,871 02:33:36,029
min 00:00:52,321 00:01:03,931 00:00:57,987 00:01:01,450 00:01:00,345 00:01:12,386 00:00:53,843 00:00:46,227 00:01:02,221
max 00:03:37,238 02:29:32,216 00:03:57,046 00:05:05,291 00:25:56,731 00:08:02,385 01:06:03,529 00:03:03,357 00:51:26,128

Le Mans 2014: GTEpro: Topspeed spread

This chart surprised me a little. The cars were almost equaliy quick – the difference was just between 2 or 4 km/h. If I had to sort the cars, I would say Ferrari quickest, followed by Corvette and Porsche with the same topspeed and the Aston Martin slightly slower. Remeber these data come from the official speedtrap and I can’t tell if this is already under braking, etc.

The Porsche #79 again is slower and the Ferrari #71 seems to be quicker, but he did only 28 laps.

LM2014_GTEpro_topspeed

Le Mans 2014: GTEpro: laptimes

For now, leaving LMP1 behind, maybe I will bring some more later.
GTEpro was fascinating to watch. Nice battles there and the #79 Porsche had only two drivers. A quick look at the laptimes shows, that the Aston Martin #97 and the quicker Corvette clearly did the fastest laptimes, but you have to bring it home to win a race – or you need to have more luck with the safety car.

The #79 Porsche is not shown here. The car, a Porsche 997 GT3 RSR, was way slower than the other cars in the class.
LM2014_GTEpro_laptimes_sorted

Le Mans 2014: LMP1: Drivers

In Le Mans teammates should be the best budies and together they should be the best unit. Take one driver out and put the next one in and you can be confident that he brings the car home in one piece as you would do. And he is quick, as you are. But he is also the next competitor. Both use the same piece of hardware and the same setup.

But remeber, when you look at these pictures, that laptimes can be influenced by team order, by fuel or race strategy or tricky weather conditions. Doing it a bit slower can be way faster at the end.

LM2014_toyota_driversLM2014_audi_drivers  LM2014_porsche_drivers

Le Mans 2014: LMP1: Topspeed spread

Another interesting fact is the topspeed in Le Mans. In the past the most significant parameter, it changed a bit over the ears. Remember the question for the „Langheck“ or „Kurzheck“ Porsche 962 when the chicanes were build.

But Topspeed is still important and a look into the oficial numbers shows something quite intersting. First of all, Audi did the fastest topspeed of all. Maybe because of a good slipstream, but everyone has expected that Porsche would take the trophy or at least Toyota. But during the weekend there were rumours that Porsche had an unexpected aero-bouncing on the front and reduced laptimes and topspeed.

Toyota found themself in discussions about a strange behaving rear wing – see Mike Fullers excellent analysis – which could also be a reason for the slower speed. More likely to me is, that the Toyota driver simply lifted the food earlier to charge the supercaps.

LM2014_topspeed_spread_LMP1 Using hybrid technologydoes mean a different way of thinking and hybrid strategy is the key to a fast and efficient lap. The graph shows slower  Toyotas at the speed trap and Audi and Porsche close by at higher speeds. The reason why I used the percent instead of absolute numbers is the different number of laps the teams did. Unfortunatly I had to remove Audi #3 and Porsche  #20 because of faulty or too little amount of datas. Audi did the fastest topspeed reaching 339,1 km/h, while the other competitors were 5-8 km/h slower. But if you take the average of all topspeeds of a car relatively to the fastest topseed you can see a bigger difference for the Toyotas than for the Audis or Porsches. This underlines that the Toyotas could have gone faster.

Audi_1 Audi_2 Toyota_7 Toyota_8 Porsche_14
91,6% 90,4% 88,0% 89,3% 91,4%

Le Mans 2014: LMP1: Gaps between the winning Audi #2 and the competitors

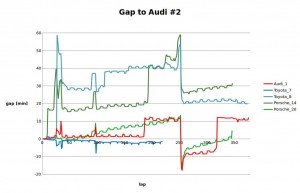
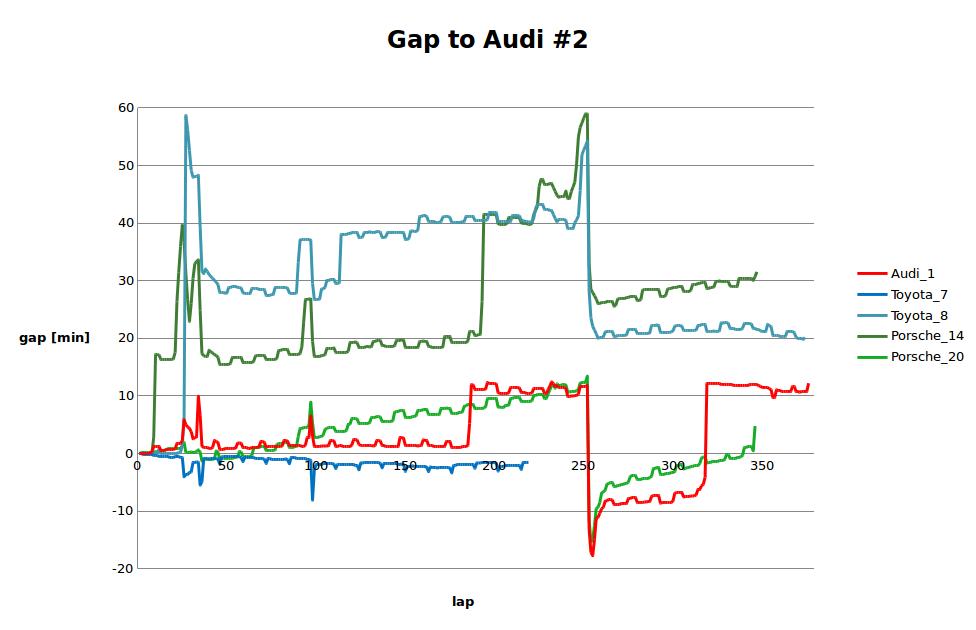
This graph shows the gaps between the winning Audi #2 and the other factory LMP1 cars.

How to read this?
Negative values mean the car is infront of the Audi #2, positive they are behind.
The little ripple come from pitstopps.

What we can see is, that the Toyota #7 was in the lead all the time (as we know) until it broke down, but because the line is relativly flat, both car did very similar laptimes. A reason could be that the Toyota took it easy or both cars were very equal.

The Porsche #20 tells a different story. Over the laps the graphs is rising, because the Audi #2 was constantly faster until around lap 250, when the turbo of the #2 had to be changed, and the Audi #1 and the Porsche #20 entered P1 and P2.

Before the 2014 race, ACO and FIA installd the Slow Zones to reduce the safety car problems where others can be penalized just because the safety car came out at the wrong time. Unfortunatly the safety cars came out this year again and again some had a big gap of a few minutes. Which can easily be seen at around lap 25. There has to be something for the future!

gap2audi2

Le Mans 2014: LMP1: Laptimes

Quick look at the laptimes.

The graph shows very clearly, that the Porsches surprisingly haven’t had the pace of the Audis and Toyotas over the distance while the Audi also surprisingly were close to the Toyota. My guess the Audis, especially #2, had to go really flatout, while the Toyota did it more easily. However at the end Audi won – again.

3:22min of André Lotterer was another surprise to me. He nailed it again.

Never underestimate Audi over the distance is something Peugeot had to learn and Toyota got the lesson the hard way, too. Will try to display that.

laptimesorted

Le Mans 2014: LMP1: the day after and a quick look at the pitcrews

What a race!

I think we have seen one of the best Le Mans races of the past years and I will throw in some analysis the next days. There is one thing that impressed me when I had a quick look at the race datas:

Porsche #20 did a very clean race. Only schedules stopps and all within the same times, without the bad luck at the end, when the motor stopped working, they would have finished a good result. Audi and Toyota pitcrews did both awesome jobs. There is no difference between the two companies – always perfect work. The Porsches were always 5-10s slower. Rumours say they had problems to fill the ful cell as quickly as the others do.

To me, the pitcrews are always the heroes, who have to do perfect jobs all the time, the whole week!


Audi_1 Audi_2 Audi_3 Toyota_7 Toyota_8 Porsche_14 Porsche_20
00:52,037 00:57,658 00:54,394 00:58,396 00:55,682 14:46,982 01:01,400
00:58,961 01:22,078 00:59,048 01:20,521 00:57,307 03:11,274 01:28,515
04:08,464 02:30,673   03:57,237 49:26,521 01:29,566 01:27,358
01:18,986 01:17,062   01:16,335 01:17,167 01:03,500 01:00,786
00:57,272 00:58,407   00:58,427 01:08,055 01:03,281 01:24,134
00:57,469 00:57,678   00:58,432 00:57,569 01:26,624 01:00,743
00:58,740 00:57,375   01:21,225 01:21,942 01:03,135 01:23,722
01:24,733 03:23,798   04:25,737 01:09,289 01:03,488 01:01,156
00:56,947 00:57,357   00:57,172 01:45,582 01:37,065 01:06,449
00:59,424 00:57,733   01:26,996 01:10,798 01:03,515 01:01,276
00:57,587 00:57,848   00:58,954 08:29,599 01:03,217 01:27,139
01:31,416 01:25,468   00:58,729 00:57,837 01:03,210 01:00,830
00:57,453 00:58,056   00:57,993 00:58,789 01:55,469 01:01,661
00:58,015 01:07,911   01:27,016 01:22,922 01:48,564 01:01,270
00:57,955 00:57,504   01:02,172 02:29,739 15:07,568 01:24,895
06:49,642 01:36,440   00:57,753 00:58,702 01:04,980 01:15,625
01:18,202 00:57,894   01:23,783 00:58,754 01:04,963 01:00,629
00:58,234 00:58,765     01:22,126 01:21,346 01:24,701
00:57,277 01:29,602     00:59,139 01:04,816 01:10,086
00:57,644 23:18,628     01:12,592 01:08,536 01:02,804
01:23,493 00:57,617     00:58,776 01:05,338 01:00,661
01:06,177 00:57,381     03:03,137 01:43,009 01:25,952
00:57,568 01:27,045     00:57,420 01:05,795 01:02,009
00:57,594 00:57,375     00:58,484 01:05,026 01:01,891
01:23,290 01:22,341     01:25,814 01:04,169 01:02,192
00:57,296 00:57,540     00:58,827 01:27,418 01:23,065
00:46,362 00:57,848     00:58,173 01:20:44,790  
17:36,923 01:28,293     01:32,834    
00:57,717 00:58,987     00:58,396    
00:57,042       01:22,918    
01:30,167       00:55,363    
00:52,222            
 Table shows pitstop times